Reliability of Quantitative Ultrasound Measures of the Biceps Tendon: A Preliminary Study Among Non-Wheelchair Users
Dany Gagnon, PhD, PT1,2 ; Jennifer L. Collinger, BS1-3 ;Bradley G. Impink, BS1,3 ;
Alicia M. Koontz, RET, PhD1,3 ; Michael L. Boninger, MD1-3
(1) Human Engineering Research Laboratories, VA Pittsburgh Healthcare System, 7180 Highland Dr., Building 4, 151R-1, Pittsburgh, PA 15206
(2) Department of Physical Medicine and Rehabilitation, University of Pittsburgh
(3)Department of Bioengineering, University of Pittsburgh
ABSTRACT
Precise quantification of shoulder tendon health using ultrasound measures may lead to a better understanding of the etiology of secondary upper limb impairments reported among manual wheelchair users (MWU), and consequently guide rehabilitation interventions aiming to preserve U/E integrity in this population. Despite the growing interest for this technique, there have been very few attempts to establish the psychometric properties of quantitative ultrasound measures. This study aimed to determine the intra-rater reliability and to calculate the minimal detectable change of key quantitative ultrasound measures (width and echogenicity) of the long head of the biceps tendon (LHBT) among non-wheelchair users. Quantitative ultrasound measures of the LHBT were found to demonstrate good intra-rater reliability (f>0.942) and limited standard error of measurement (<4.711%) among non-wheelchair users. Hence, acute LHBT changes that may occur after a strenuous period of physical activity may be accurately detected using pre- and post-activity quantitative ultrasound measures.
KEY WORDS
Reliability, Minimal Detectable Change, Ultrasound, Shoulder, Biceps Tendon.
BACKGROUNG
Manual wheelchair users (MWU) rely on their upper limbs for propulsion and many other wheelchair-related functional activities, such as weight-relief lifts and transfer tasks (1). Over time, the increased muscular demand and elevated forces placed on their upper limbs may augment the risk of developing secondary impairments affecting the integrity of the musculoskeletal structures at the shoulder joints (1). This hypothesis is further supported by the high prevalence of shoulder joint complaints (30-73%) documented among this population (1). These impairments may, in turn, have deleterious consequences on the ability to perform functional activities and may restrict social participation among MWU (1).
Precise quantification of shoulder tendon health using quantitative ultrasound measures may lead to a better understanding of the etiology of these secondary U/E impairments, and consequently guide rehabilitation interventions aiming to preserve U/E integrity among MWU (2, 3). Quantitative ultrasound measurement is a non-invasive, easily accessible and safe method that can be used to characterize soft tissue structures surrounding the shoulder joints, such as the long head of the biceps tendon (LHBT) (2,3). Despite the growing interest for this well established technique, there have been very few attempts to establish the psychometric properties of quantitative ultrasound measures. Moreover, no study has specifically determined the intra-rater reliability and the minimal detectable change of the LHBT width and echogenicity outcomes. This information is needed to develop an effective measurement protocol aiming to quantify acute tendon changes linked to manual wheelchair propulsion among individuals with SCI.
RESEARCH QUESTION
The objective of this study was to determine the intra-rater reliability and to calculate the minimal detectable change of a new quantitative ultrasound measurement protocol developed to assess properties ofthe LHBT.
METHOD
Participants:
Thirteen able-bodied individuals (10 male and 3 female subjects; age=41.4 years (14.3); height= 1.81 m (0.09); body mass=81.6 kg (11.3)) volunteered to participate in this reliability study. All participants reviewed and signed an informed consent form before entering the study.
Quantitative Ultrasound Examination:
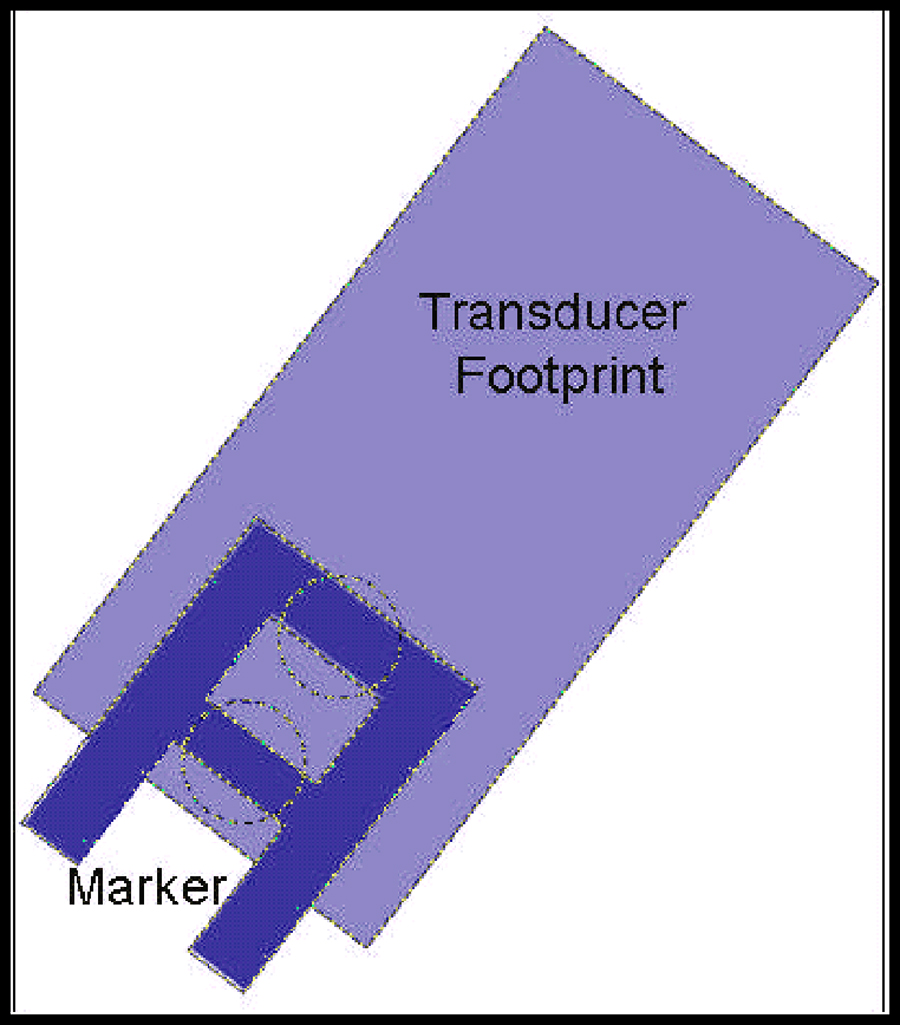 Figure 1: Schematic representation of the steel marker location within the portion of the tendon recorded with the transducer. (Click for larger view)
 A well-trained rehabilitation specialist completed the quantitative ultrasound examination of the non-dominant LHBT using a Phillips HD11 1.0.6 ultrasound machine with a 5-12 MHz linear transducer (Philips Medical Systems, Bothell, WA) for all participants. A standardized quantitative ultrasound examination protocol was designed to maximize reliability of the quantitative ultrasound outcomes. To this effect, participants were asked to sit in an upright position in a chair with their non-dominant upper arm in line with the trunk, the elbow flexed to 90º, and forearm and hand resting on the ipsilateral thigh. Occasionally, a foam block was placed on the participant’s thigh to achieve 90º of elbow flexion. The transducer was oriented to obtain the best longitudinal view of the LHBT using the lesser tuberosity of the humerus as a bony landmark. Then, transducer location was traced on the skin to approximate probe location. Next, a steel marker was fixed to the skin, within the surface covered by the probe, to create an interference pattern on the ultrasound image as shown in figure 1. Once this initial set-up was completed (occasion #1), two consecutive longitudinal ultrasound images (images #1 and #2) of the LHBT were collected. Once the images were taken, the marker was removed and the skin was cleaned to erase all marks. After a rest period of approximately 20 minutes, participants underwent a second quantitative ultrasound examination (occasion #2) during which two additional images (images #3 and #4) of the LHBT were recorded. Care was taken to maintain the same standardized seated position, to keep the system-setting parameters constant and to replicate the exact measurement protocol during the two examinations (occasions #1 and #2). Machine settings were kept identical across all participants (depth= 4cm; gain 85 dB).
Quantitative Ultrasound Measures:
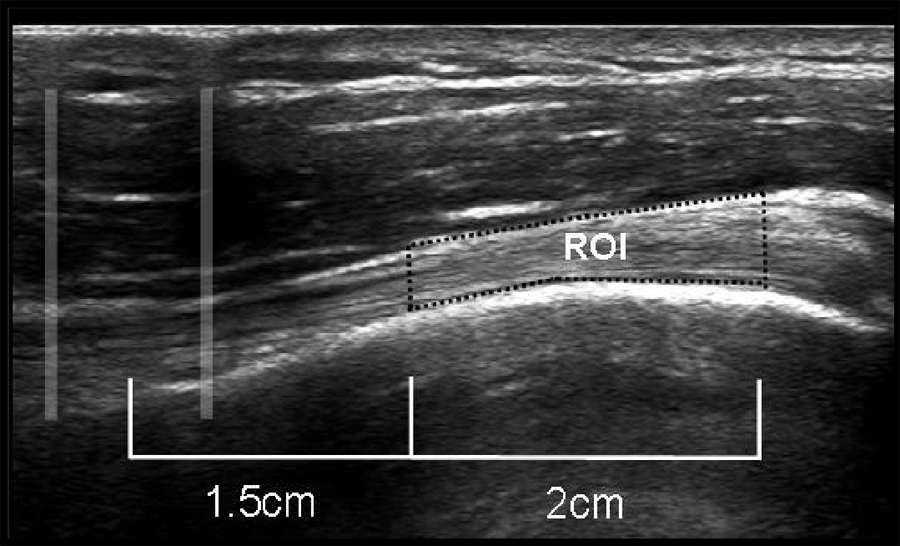 Figure 2: Marker interference pattern and region of interest of the long head of the biceps tendon (Click for larger view)
 To calculate the quantitative ultrasound measures of the LHBT, a 2-cm long region of interest (ROI), located 1.5 cm proximally from the center of the interference pattern, was selected using a customized interactive Matlab program (The Mathworks, Natick, MA) as illustrated in figure 2. This software was also used to measure the width and echogenicity of the ROI.
To determine the width, the upper and lower boundaries of the ROI are identified by manually clicking the top and bottom borders of the tendon and fitting a 200 point cubic spline to each line. Each line is converted into 10 sub-sections. Then, the minimal distance between the boundaries is computed within each sub-section. Finally, all minimum distance values are averaged to quantify tendon width within the ROI.
To determine the echogenicity, each square pixel (surface=0.087mm2/pixel) located within the ROI has an assigned greyscale value ranging from 0 (black) to 255 (white). Then, all greyscale values are averaged to calculate the mean echogenicity of the ROI.
Reliability Analysis
The generalizability theory provided a framework to evaluate the reliability of the quantitative ultrasound measures of the LHBT (4). This theory is considered as an extension of the intra-class correlation coefficient (ICC). Based on the analysis of variance, the generalizability theory is divided into two parts: the generalizability study (G-study) and the dependability study (D-study). The G-study allows one to determine the magnitude of the variances attributed to the participant (P), to the systematic errors related to occasion (O) and image (I), and to random errors associated with the interactions between between the different sources of variance (PO, PI, OI). The residual error is the interaction between all sources of error and corresponds to the participant, occasion and image variances (POI) involved. Thus, seven sources of error variance (P, O, I, PO, PI, OI, and POI) can be identified. The D-study relies on information generated from the G-study to determine the reliability of specific pre-determined testing protocols. In the current study, mixed design with the occasion as a fixed facet was considered to estimate the intra-rater reliability for hypothetical protocols of one occasion using one image, the average of two images and the average of three images. In these situations, the variability associated with the occasion was not taken into consideration. The G- and D-studies allow the calculation of dependability coefficients (f) considered as reliability coefficients (5). The dependability coefficient is the ratio between the inter-participant variance and the sum of the inter-participant variance and all possible sources of error. The sum of the error variances (systematic and random) is called the absolute error variance. Like the ICC, the dependability coefficient ranges between 0 (null reliability) and 1 (perfect reliability) and values above 0.75 can be considered as having good reliability (6). Note that the dependability coefficient (f) may remain elevated despite large measurement errors. Hence, the standard error of measurement (SEM), which is the root square of the absolute error variance, was also described according to the units of the quantitative ultrasound measures whereas the relative SEM was expressed as a percentage of the overall mean computed. The generalizability analysis was completed with the use of the GENOVA statistical software, version 2.2 (JE Crick/National Board of Medical Examiner, Philadelphia, PA).
RESULTS
The mean (SD) width and echogenicity values, along with their minimum and maximum values, calculated for two images (I) of the non-dominant LHBT collected on two distinct occasions (O) by a unique evaluator are summarized in table 1.
The absolute and relative magnitude of variance components calculated in the G-study for each component and their interactions are presented in table 2 for the width and echogenicity values of the LHBT. For these two measures, the participant component (P) showed the largest magnitude of variance.
| Varaince Components* | Measures | |||
|---|---|---|---|---|
| Width | Echogenicity | |||
| Absolute | Relative (%) | Absolute | Relative (%) | |
| P | 0.335 | 94.052 | 481.813 | 88.468 |
| O | 0.000 | 0.000 | 0.000 | 0.000 |
| I | 0.000 | 0.000 | 3.089 | 0.567 |
| PO | 0.013 | 3.729 | 29.745 | 5.462 |
| PI | 0.000 | 0.000 | 0.000 | 0.000 |
| OI | 0.002 | 0.573 | 0.000 | 0.000 |
| POI | 0.006 | 1.647 | 29.968 | 5.503 |
| Total | 0.356 | 100.000 | 544.615 | 100.000 |
| * P=participant; O=occasion; I=image; PO= participant-occasion interaction; PI= participant-image interaction; OI=occasion-image interaction; POI= participant-occasion-image interaction (includes the error). | ||||
The results of the D-study for different measurement protocol designs involving the use of one image, the average of two images or the average of three images captured on two occasions by a unique evaluator to determine the width and echogenicity values of the LHBT are reported in table 3. The dependability indexes (f) revealed good intra-rater reliability when the measurement protocol is completed by a single evaluator, independently of the number of image analyzed (f>0.942). The number of images analyzed mostly affected the SEM which decreases as the number of images captured increased for one to two, and as the number of images subsequently increased from two to three images.
| Measures | Coefficient of dependability (f) | Absolute SEM | Relative SEM (%) | ||||||
|---|---|---|---|---|---|---|---|---|---|
| 2 occasions | 2 occasions | 2 occasions | |||||||
|
1 image |
2 images |
3 images |
1 image |
2 images |
3 images |
1 image |
2 images |
3 images |
Width |
0.969 |
0.975 |
0.977 |
0.103 |
0.093 |
0.089 |
2.790 |
2.517 |
2.418 |
Echogenicity |
0.942 |
0.956 |
0.960 |
5.464 |
4.729 |
4.457 |
4.711 |
4.077 |
3.843 |
DISCUSSION
This study has examined the intra-rater reliability and the SEM of quantitative ultrasound measures of the LHBT among non-wheelchair users. In general, the highest source of variance was attributable to differences among participants (P) with a percentage of total variance representing at least 88% of the total variance. Such percentages were expected since they represent the proportion of variance without error and may consequently explain the good dependability coefficient (f>0.94) found in the D-study. The systematic effect of the occasion (O) was low which confirms that only a small amount of systematic increase or decrease occurred across occasions. However, the systematic effect of the image (I) was null and confirmed that no systematic increase or decrease exists across images. The error variance component associated with the interactions between the participant and occasion (PO) was the highest whereas the other interactions were negligible and can difficultly be explained.
The effects of specific decisional situations (D-study), representative of clinical or research situations encountered by rehabilitation specialists, suggest that a single examiner collecting a single image can achieve a high degree of reliability and acceptable SEM for LHBT width and mean echogenicity. Intra-rater reliability indexes (f) are marginally affected when increasing the number of images (I) captured/analyzed (up to three) on one occasion (O). However, such an increase in the number of images (I) captured/analyzed on one occasion (O) had a greater impact on the SEM which is an estimator of the exactness of the observed score relative to the hypothetical true score. For example, if a participant has an observed LHBT width of 3.76 mm with a reported SEM of 0.093 mm ( measurement protocol: 2 occasions, 2 images) as found in this study, the true score is expected to lie between 3.58 and 3.94 mm (±1.96 SEM; smallest detectable difference) within a probability level of 95%.
CONCLUSION
Quantitative ultrasound outcomes of the LHBT, such as the width and the mean echogenicity, demonstrate good intra-rater reliability and are prone to limited amount of SEM among non-wheelchair users. The use of quantitative ultrasound measures in future studies aiming to examine acute LHBT changes occurring in response to strenuous physical activity is indicated. Quantitative ultrasound is a promising technique to develop evidence-based data required for a better understanding of the pathomechanics of secondary musculoskeletal impairment frequently affecting the upper limbs among long-term MWUs.
REFERENCES
- Consortium for Spinal Cord Medicine Clinical Practice Guidelines. (2005) Preservation of upper limb function following spinal cord injury: a clinical practice guideline for health-care professionals. First ed. Washington (DC): Paralyzed Veteran of America.
- Beggs I. (2006) Ultrasound of the shoulder and elbow. Orthop Clin North Am; 37(3):277-85.
- Kolla S, Motamedi K. (2007) Ultrasound evaluation of the shoulder. Semin Musculoskelet Radiol; 11(2):117-25.
- Shavelson RJ, Webb NM. Generalizability theory: A primer. (1991) Generalizability theory: A primer. Newbury Park (CA): Sage.
- Brennan R, Kane M. (1977) An index of dependability for mastery tests. Journal of Education and Management; 14:277-289.
- Portney LG, Watkins MP. (2000) Foundations of clinical research: Application to practice. Second ed. Upper Sandle River (NJ): Julie Alexander.